News
stock market crash 2020
Investing Strategy For Stock Market After Crash in India 2021
Stock Market After Crash in India: We have always noticed that whenever the price of stock fall in India people started Bloomberg to buy or sell their stocks but as per the advice of expert you should always make a plan and try to make the strategy of investing whenever the market crash in India.


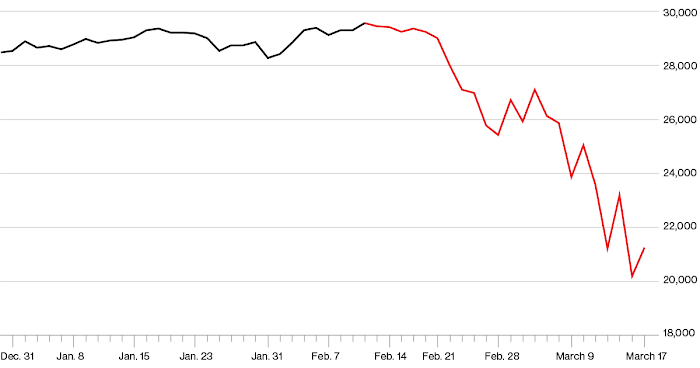
Stock Market Crash in India 2021-The Indian Stock Market has witnessed a Crash. where the market has already fallen a lot. How to invest in these falling markets? In this article, we will talk about the top 2 investing strategies for this. So, let’s begin.

1.Nifty Bees Deep Investing
First Strategy in our list is – Nifty Bees Deep Investing. So, see, when the stock market falls that time, even the best of individual stocks fall by a lot. And many of those companies never recover. That means, their stock might never go up again. So, if you are betting on a stock, the risk is much higher. In this environment, if you want to play safe, the NIFTY 50 Index is the way to go.
Nifty 50 is the combination of Top 50 stocks in India. This has different stocks from different sectors. Like HDFC, HDFC Bank, ICICI Bank, and many such famous stocks. And the best thing about Nifty 50 is, its list of top 50 stocks is revised every 6 months. This means if a stock is top 50, but continuously going down It will be thrown out of Nifty 50. And to replace it, a performing stock is added in Nifty 50. Because of this property of Nifty 50, if Nifty 50 has fallen down, its probability of going up is much higher.
Because it always has the Top 50 stocks of India. If we talk about history in 2008, many good stocks fell by 90% – 95% In that environment, Nifty also fell by 65%. But recovery after that was significant. Because, the stocks which could not recover after that fall, were thrown out of Nifty 50. And the stocks which could recover after that fall were put into Nifty 50.
Because of this, Nifty 50 kept on hitting All-Time-Highs consistently. This fact is applicable to all stock market falls. And due to this reason, in a stock market fall, if you invest in Nifty 50, instead of Individual Stocks It will be a safer bet. But, Nifty 50 is an Index.
So, you cannot invest your money directly in it. But you can invest your money in Nifty’s ETF, which is NIFTY BEES. If you use a Zerodha Account, you can go on the Search option and type NIFTY BEES. You will see 2 NIFTY Bees. One is the NSE Version, and the other is BSE Version. Prefer to invest in NSE.
The process to buy it similar to buying any stock. Click on BUY. Enter the quantity you want to buy. And it will be bought. You can see, the price of Nifty Bees is too small. Only around Rupees 90. And it’s Change Percentage works like Nifty 50. It means, when Nifty 50 goes up by a certain percentage, Nifty Bees go up in almost the same proportion.
When Nifty 50 goes down by a certain percentage, Nifty Bees go down in almost the same proportion. Now the main question is – When to buy NIFTY Bees? And how much to buy? You can follow multiple formulas for this. I am showing you the example of some of those formulas. You can use any of these indexes as per your choice.
In our formulas, we are assuming that the Nifty Index can fall up to 80%. It has never happened in history. Historically, the biggest fall in Nifty is 65%. It happened in 2008. So, we are starting by assuming the worst. And this is a good thing. Now the formula is very simple. Whatever is Nifty’s All-Time-High at that time when Nifty falls 10% from there, then we have to invest our money.
When it falls 10% more from there, we have to invest our money again. When it falls 10% more, again we have to invest our money. Do remember, we have to see the fall in NIFTY 50. And we have to invest our money in Nifty BEES. Now, as per our First Formula, we have to invest equal money at all points. Meaning, if we are investing 10 rupees at the first point (10% fall), we must invest 10 rupees at every 10% fall. This investment will remain constant at every investment point.
We have to continuously do it at every 10% fall, till the market falls to 80%. Now, as per our second formula till 40% fall, we have to do exactly what we were doing in formula 1. That is, we have to invest an equal amount at every 10% fall. When the market falls to 50%, we have to invest double the amount at every point. It means if we were investing Rs.10 at every point till 40%, from 50%, we have to invest Rs.20 at every point.
This will bring our break-even point lower. These formulas are called ‘Bottom Heavy’. And as per our last formula, you have to double your investment at every investment point. If you invest Rs.10 on the first point, you have to have Rs.20 on the second point. Rs.40 on the next point.
Then Rs.80 at the next point. Like this, you have to double your investment money at every investment point, i.e. Every 10% Fall. This formula is called ‘Averaging’. The people who know me personally know that I am not in favor of averaging.
I generally avoid averaging. But when we are investing in a stock market crash averaging can prove to be a good thing then. But it is not good for individual stocks.
2. Relative Strength Stock Picking- Stock Market Crash in India 2020
Our next strategy is – Relative Strength Stock Picking. You must have observed in the current stock market crash or in the past stock market crashes that some stocks fall a lot in these crashes. And some stocks either fall very less or don’t fall at all. And when the stock market recovers from its crash at that time, the stocks which fell very less, or didn’t fall, those stocks go up with the fastest speed And Stock Market Crash is the best time to find these stocks. At these times, you can filter out the stocks which will run like a horse and stocks which are useless.
They won’t go up. So, let’s first understand why this happens. See, the market has 2 types of stocks. First are those, where operators keep on selling. And no operator buys from them.
So, these stocks keep on going down and down. These stocks witness huge falls. And on the other hand, there are stocks where selling is limited. And whatever selling is there, the operator buys from those sellers. And then the stock goes up. And then again, some selling happens, and then the operator starts buying from them again. And stock again starts going up.
That’s why these stocks cannot fall much. Because operators keep on buying these stocks or accumulating these stocks at lower prices. The operator doesn’t let these stocks fall down. The operator has a personal liking in these stocks.
In Relative Strength’s Language, these stocks are called ‘Relative Strength Positive Stocks’. We call them RS+. And these stocks are called ‘Relative Strength Negative Stocks‘. As in, they are falling much more compared to the overall stock market. So, you must remember, we only have to invest in RS+ Stocks, not in RS- Stocks. Because the probability of RS- stocks going up is very less. And the probability of RS+ stocks going up is much more. Now, to find these RS+ stocks, you have to use charts.
I am using the Trading View Charts. I am using Weekly Time Frame here. Meaning, I am looking at a large scale as which stocks are good to invest in. So, if you want to find out if you stock is RS+ or RS- then you have to divide your stock with divide. Where you write the name of the stock, type the Divide sign there. And then write ‘Nifty’. A Spread Chart of your stock will be opened.
These charts are called Spread Charts where you divide one symbol with another. Here, we are dividing Stock with Nifty (i.e. Market). We want to find out if our stock is going up more than the market, or not. If it is falling less, or not. Both these definitions are of RS+ Stocks. If this chart is going up, it means our stock is RS+ stock. For example, here is IndusInd Bank Stock.
I have divided it by Nifty 50. And you can see, this spread chart is trending to the downside. Meaning, it is the case of Negative Relative Strength. It means you should not invest in IndusInd Bank. Similarly, you can also look for sectors. For example, on my screen, I have divided the Pharma Sector with Nifty 50. And you can see, the pharma sector is showing positive relative strength compared to Nifty 50. For now, this positive relative strength’s history is very small. I want this to be positive for some more time. Then, we will get confirmation. But yes, it has already started giving good initial signs.

So, if I want to invest my money in Pharma Sector, I will feel confident after watching this chart. I will prefer pharma stocks. Similarly, you can perform a sector analysis. There is one more variation possible here. Currently, we are dividing symbols with Nifty 50. As in, our definition of the market is Nifty 50. We can also replace it with Nifty 500, which is a wider index.
It contains the top 500 stocks of India. So, you can apply this in your charts to experiment with it. Some people prefer Nifty 50, some prefer Nifty 500 and some prefer Nifty 200. You can experiment with this and I am sure you will get positive results. If you track my investing, then you must be knowing that I do relative strength investing at a large scale.
We analyze every sector like this. Firstly, we figure out, in which sector we should invest in. Then, we find the best stocks in those sectors. And this is a very good way of shortlisting stocks. You must remember, this is just a way to shortlist stocks. You must further analyze the shortlisted stocks for confirmation. For that, you can use either technical or fundamentals, as per your preference. This strategy is also explained in detail at ‘Flyers School of Stocks’. This was our list of Top 2 Stock Market Crash Investment Strategies.
Conclusion:
In this post, we have shared Investing Strategy For Stock Market After Crash in India 2021 the ideas and the experience and rest is all your findings. If you find this helpful kindly share on Facebook and Twitter.
0 Comments: